The nanobeam sessions used well-separated diffraction disks and asked where the diffraction spots are. The afternoon asks a different question: what phase shift did the sample imprint on the electron wave? Thin samples are nearly transparent to fast electrons; they barely absorb, but they do shift the phase of the beam in proportion to their projected electrostatic potential. Recovering that phase gives the most dose-efficient imaging available for thin, weakly scattering, and beam-sensitive samples Ophus (2019).
From nanobeam to overlapping disks
The convergence angle now plays the opposite role from the morning. At small α, the diffracted disks are separate and their positions carry the information. At large α, the disks overlap, and the interference in the overlap regions carries the information: the phase difference between the direct beam and each diffracted beam is encoded in intensity modulations that shift as the probe scans.
A probe scanning across a sample potential (red): the bright field disk responds to the local electric field. This is the signal that center-of-mass imaging reads out.
The three movies below show the same scan at increasing convergence angle, from the nanobeam regime of the morning sessions to the overlapping-disk regime that DPC and ptychography exploit:
Nanobeam regime (small convergence angle): the probe is wide in real space, the disk is small and sharp, and the center of mass (cyan) barely responds. This is the regime for disk positions: strain and orientation mapping.
Intermediate convergence: the probe sharpens in real space and the disk grows. The center of mass now tracks the local field as the probe crosses the potential: this is the DPC operating point.
Overlapping-disk regime (large convergence angle): the probe is smallest, and the diffracted beams interfere inside the large bright field disk. The center of mass still measures the field, and the interference structure is what ptychography decodes.
The method ladder
Center of mass / DPC. The center of mass of each diffraction pattern measures the average in-plane momentum transferred to the beam, which is proportional to the electric field of the sample. The field is the gradient of the potential, so integrating the center-of-mass signal reconstructs the phase Shibata et al. (2012). Fast, simple, and a good diagnostic: a correct scan–detector rotation gives clean dipole contrast along x in CoMx and along y in CoMy, so this doubles as the rotation calibration.
Tilt-corrected bright field (parallax). Every pixel inside the bright-field disk is a plane-wave image of the sample from a slightly different angle. With a defocused probe, these images are shifted copies of each other; cross-correlating and aligning them recovers the phase, measures the aberrations (the shift field is the gradient of the aberration surface), and can be upsampled beyond the scan sampling.
Direct (single side-band) ptychography. Integrate the interference in the disk-overlap (“double overlap”) regions analytically, correcting phase and amplitude variations in a single pass.
Iterative ptychography. Solve for the complex object (amplitude and phase) that explains all of the recorded interference at once, while simultaneously recovering the probe Rodenburg & Faulkner (2004), Maiden & Rodenburg (2009). Iterative solvers deconvolve the probe from the object and reach resolutions beyond the aperture limit Jiang et al. (2018).
How well each method transfers spatial frequencies is summarized by its contrast transfer function (CTF), and the ranking depends strongly on focus Varnavides et al. (2026):
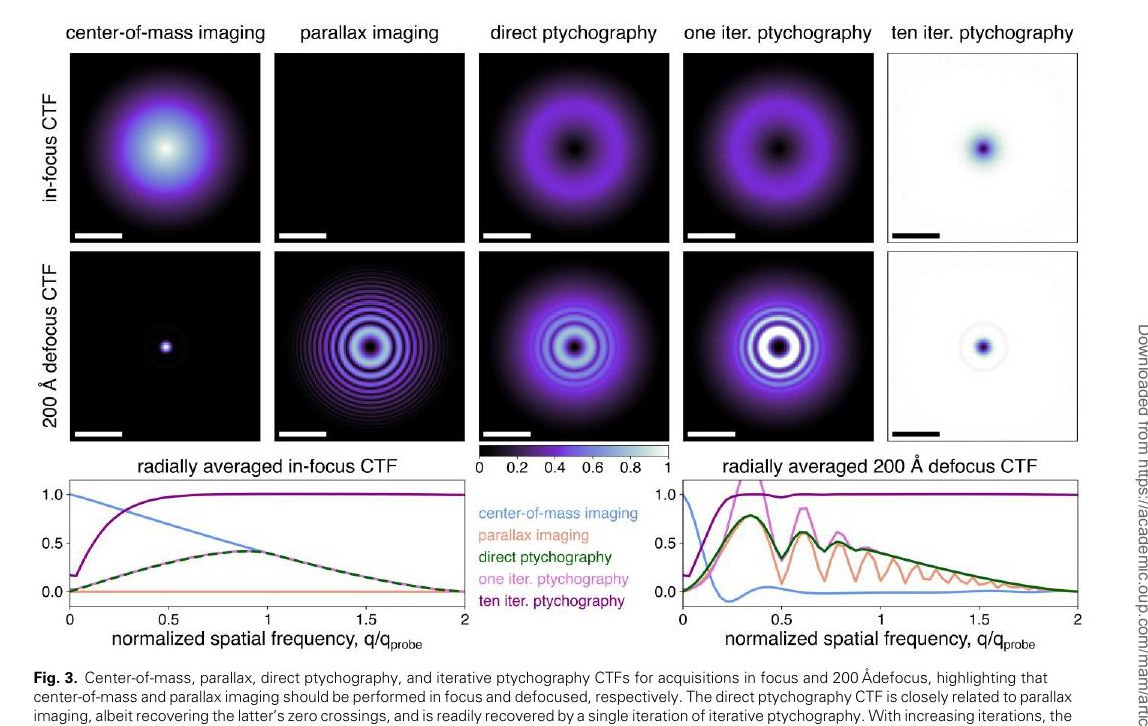
The method ladder in transfer-function form: center-of-mass imaging wants to be in focus, parallax requires defocus, direct ptychography recovers the parallax zero crossings, and iterated ptychography approaches unity transfer. Adapted from Varnavides et al. Varnavides et al. (2026).
Beyond contrast transfer: dose decides
The CTF describes the maximum transmittable signal and ignores the Poisson statistics of finite electron dose, so it can badly overestimate practical performance in exactly the low-dose regime where phase contrast matters most. The spectral signal-to-noise ratio (SSNR) is the finite-dose metric: center-of-mass, parallax, and direct ptychography have dose-independent SSNR shapes, while iterative ptychography behaves like direct ptychography at low dose and only unlocks its full transfer as fluence increases Varnavides et al. (2026):
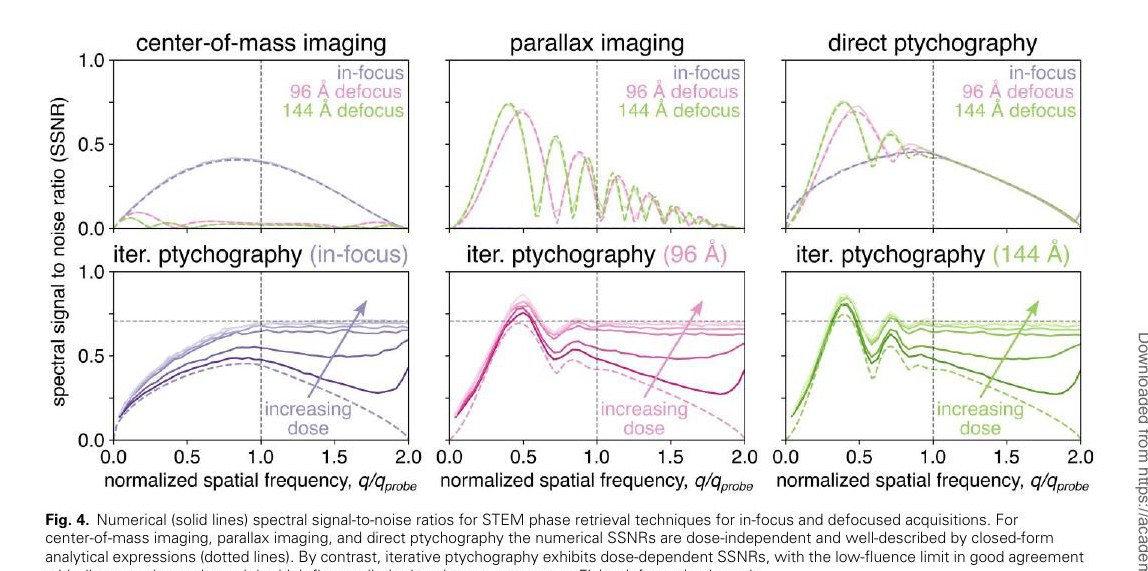
Spectral SNR at finite dose: iterative ptychography (bottom row) is dose-dependent, converging to direct ptychography at low fluence and saturating at high fluence. Method choice is a dose question, not just a CTF question. Adapted from Varnavides et al. Varnavides et al. (2026).
Practical notes
Defocus is a design parameter. Center-of-mass imaging and virtual imaging want a focused probe; parallax and ptychography want defocus, because the enlarged probe footprint creates the real-space overlap between neighboring scan positions that the reconstructions exploit.
The 180° rotation ambiguity is physical. An incorrect rotation solution inverts the reconstructed phase. Check the sign: atoms are positive potentials, so the phase shift over an atomic site must be positive.
Phase wraps on strong scatterers. Thin, light samples are ideal; for thicker crystals, multiple scattering demands multislice-aware reconstructions.
Hands-on: the full ladder on a simple system
This hands-on session walks the full phase-retrieval ladder on a simple system: a thin, well-behaved experimental dataset (gold nanoparticles on carbon) where every method works and the differences between them are easy to see.
The workflow
Load and inspect. Mean and max patterns, virtual BF/ADF images. With a defocused probe the virtual images look blurry; that is expected, and it is exactly the overlap that ptychography will exploit:
The input data: a defocused probe rastered over a 2D crystal. Without the sample, the enlarged bright field disk is smooth.
With the sample in place, the overlapping disks fill with interference speckle. That speckle encodes the relative phases of the diffracted beams, and it is exactly what direct (SSB) and iterative ptychography decode.
DPC. Compute the center of mass, solve for the scan–detector rotation (clean dipoles in CoMx/CoMy), and integrate to get a first phase image. Check the sign: nanoparticles must come out as positive phase.
Parallax. Align the virtual images from within the BF disk; the cross-correlation shifts visualize the aberration surface, fit the defocus and astigmatism, and kernel-density upsampling recovers detail beyond the scan step.
Ptychography. Seed a single-slice reconstruction with the rotation and defocus measured by parallax, then iterate: the solver jointly refines the complex object and the probe. The reconstructed object is complex, with both amplitude and phase:

Reconstructed objects are complex-valued: phase (hue) and amplitude (brightness). For thin samples nearly all of the information is in the phase.
Why this matters
Phase contrast reconstructions are far more dose-efficient than incoherent imaging for thin samples: the same information comes out at a fraction of the fluence, which is what makes atomic-resolution imaging of beam-sensitive materials possible. The iterative framework also opens the door to super-resolution beyond the aperture limit Jiang et al. (2018), aberration correction in software, and multislice reconstructions that recover depth information Chen et al. (2021).
An overview of the open-source implementations of these methods (and how they relate) is on the software page; the iterative algorithms themselves are reviewed in arXiv:2309.05250.
- Ophus, C. (2019). Four-Dimensional Scanning Transmission Electron Microscopy (4D-STEM): From Scanning Nanodiffraction to Ptychography and Beyond. Microscopy and Microanalysis, 25(3), 563–582. 10.1017/s1431927619000497
- Shibata, N., Findlay, S. D., Kohno, Y., Sawada, H., Kondo, Y., & Ikuhara, Y. (2012). Differential phase-contrast microscopy at atomic resolution. Nature Physics, 8(8), 611–615. 10.1038/nphys2337
- Rodenburg, J. M., & Faulkner, H. M. L. (2004). A phase retrieval algorithm for shifting illumination. Applied Physics Letters, 85(20), 4795–4797. 10.1063/1.1823034
- Maiden, A. M., & Rodenburg, J. M. (2009). An improved ptychographical phase retrieval algorithm for diffractive imaging. Ultramicroscopy, 109(10), 1256–1262. 10.1016/j.ultramic.2009.05.012
- Jiang, Y., Chen, Z., Han, Y., Deb, P., Gao, H., Xie, S., Purohit, P., Tate, M. W., Park, J., Gruner, S. M., Elser, V., & Muller, D. A. (2018). Electron ptychography of 2D materials to deep sub-ångström resolution. Nature, 559(7714), 343–349. 10.1038/s41586-018-0298-5
- Chen, Z., Jiang, Y., Shao, Y.-T., Holtz, M. E., Odstrčil, M., Guizar-Sicairos, M., Hanke, I., Ganschow, S., Schlom, D. G., & Muller, D. A. (2021). Electron ptychography achieves atomic-resolution limits set by lattice vibrations. Science, 372(6544), 826–831. 10.1126/science.abg2533