

X-ray photoelectron spectroscopy (XPS) is the standard measurement of surface chemistry. It identifies every element except hydrogen and helium in the top few nanometers of a sample, quantifies them to within a few percent, and, through small shifts in binding energy, reports how each element is chemically bonded. Nearly every materials laboratory has access to an XPS instrument, and for identifying what is on a surface and what chemical state it is in, XPS is almost always the first technique to use.
| At a glance | |
|---|---|
| Probe in / signal out | Soft X-rays in, photoelectrons out |
| Information | Elemental composition (Z of 3 and above), chemical/oxidation state, overlayer thickness |
| Depth probed | 3 to 10 nm; tunable shallower by angle-resolved measurement |
| Lateral resolution | 10 um to millimeters; imaging modes to about 3 um |
| Sensitivity | 0.1 to 1 atomic percent |
| Sample requirements | UHV compatible; insulators fine with charge compensation; nearly nondestructive |
The photoelectric effect as spectroscopy
A monochromatic X-ray of energy ejects a core electron whose kinetic energy is measured by an electrostatic analyzer. Energy conservation gives the binding energy of the level it came from:
with the binding energy of the level the electron came from, the photon energy, the measured kinetic energy, and the spectrometer work function; for conductive samples in electrical contact with the spectrometer, binding energies are referenced to the common Fermi level, which is why the same instrument constant serves every sample. Standard sources are Al K (1486.6 eV, almost always monochromated) and Mg K (1253.6 eV). Since every element has a unique ladder of core-level binding energies, a survey spectrum identifies all elements present from lithium up.
Several systematics organize a real spectrum. Core levels with orbital angular momentum split into spin-orbit doublets (/, /, ...) whose intensity ratios are fixed by degeneracy (1:2, 2:3, 3:4) and whose splittings are characteristic of the element, a built-in consistency check when assigning overlapped chemistry. Peak intensities scale with the photoionization cross section of each level at the photon energy used (tabulated by Scofield; they vary by orders of magnitude across the periodic table, the physical core of the sensitivity factors used in quantification). Auger peaks appear in every XPS spectrum too, at kinetic energies independent of , so switching anodes moves them on a binding-energy plot, the classic trick for untangling an Auger-photoelectron overlap. And every sharp line drags behind it (at higher binding energy) an inelastic background of electrons that lost energy on the way out; the background step across each peak is itself informative, since deeply buried emitters produce more background than surface emitters.
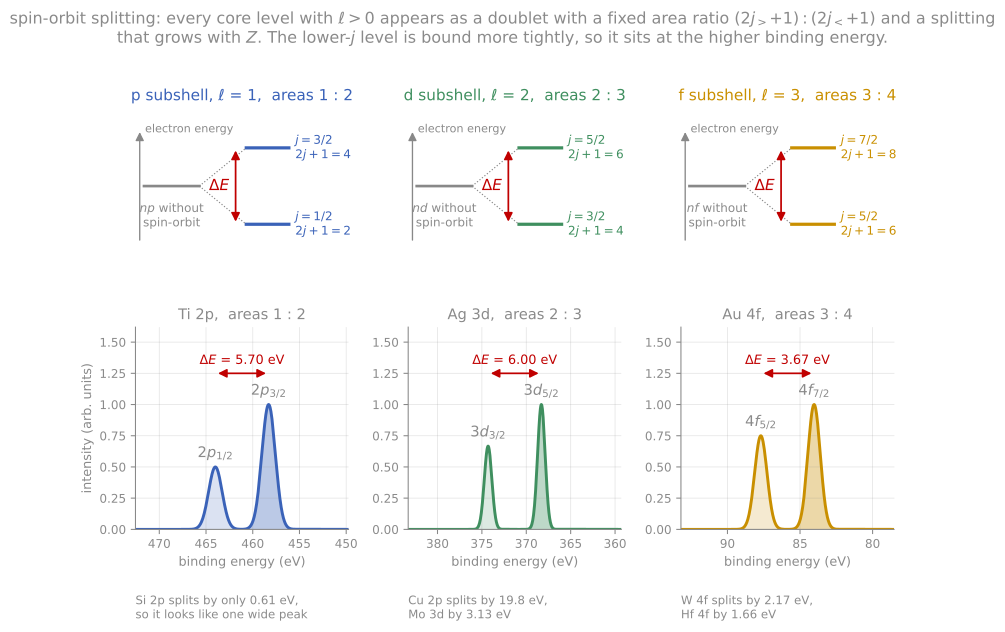
Every level with splits into a doublet whose area ratio is fixed by the degeneracies and whose splitting grows with atomic number.
The surface sensitivity comes entirely from the escape-depth physics of the outgoing photoelectron: the X-rays penetrate micrometers, but only photoelectrons born in the top few nanometers escape unscattered.
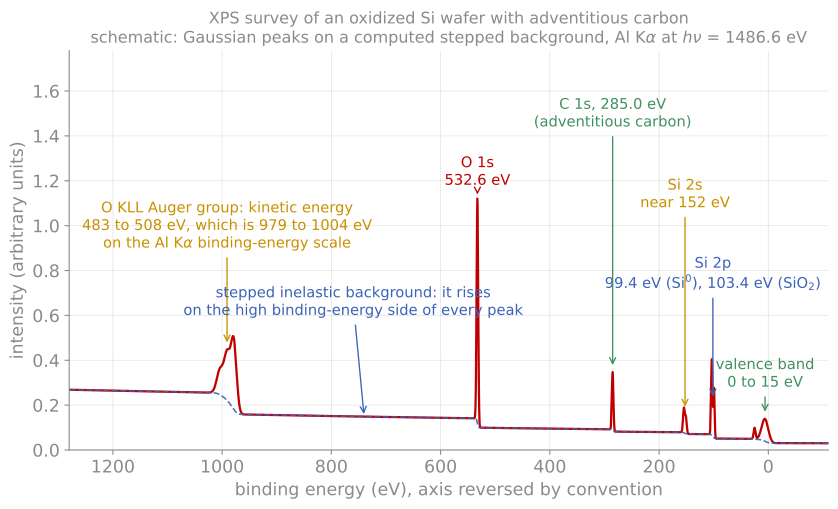
A survey spectrum of an oxidized silicon wafer with adventitious carbon, with the core lines, the Auger group, the valence band, and the stepped inelastic background labelled.
Chemical shifts
The measurement that makes XPS indispensable is the chemical shift: the binding energy of a core level moves by up to several eV with the atom’s bonding environment. The classical picture (Siegbahn’s charge-potential model) captures it: withdraw valence charge from an atom and the remaining electrons, including the core ones, sit in a deeper potential; add charge and they sit shallower. Binding energy therefore tracks oxidation state, with each additional oxidation step adding roughly an eV. Si metal and SiO are separated by about 4 eV in the Si 2p line, and a native-oxide-covered wafer shows both peaks at once, with suboxide intermediates resolvable between them. Carbon 1s resolves C-C, C-O, C=O, and O-C=O within about 5 eV, the basis of polymer and contamination analysis.
The initial-state charge picture is completed by final-state effects, which are diagnostic in their own right. The measured energy includes the relaxation of the other electrons screening the new core hole; when that screening arrives in more than one way, satellites appear. Shake-up satellites (the outgoing electron leaves the ion excited) are fingerprints in transition-metal oxides: the strong Cu 2p satellite distinguishes Cu(II) from Cu(I) and Cu(0) at a glance, a lineshape identification that survives even when the peak positions are ambiguous. Open-shell ions show multiplet splitting, free-electron-like metals show plasmon replicas, and metals show characteristically asymmetric lineshapes from electron-hole excitations at the Fermi level. A further robust identifier is the Auger parameter (Wagner): the sum of a photoelectron binding energy and an Auger kinetic energy from the same element, which is independent of any charging or referencing error and often separates chemical states that the photoelectron shift alone cannot.
Reading shifts quantitatively requires care with referencing. Insulating samples charge positively under photoemission, shifting the whole spectrum; a low-energy electron flood gun compensates, and the residual offset is removed by referencing to a known line. The traditional reference, adventitious carbon at 284.8 eV, is convenient and increasingly criticized as unreliable; internal references (a substrate line, or the Auger parameter) are better practice. Peak fitting of overlapping chemical states is standard and is a well-known source of unreliable literature: fits must be constrained by the physics (doublet separations and ratios, plausible widths, consistent references), not merely by residuals.
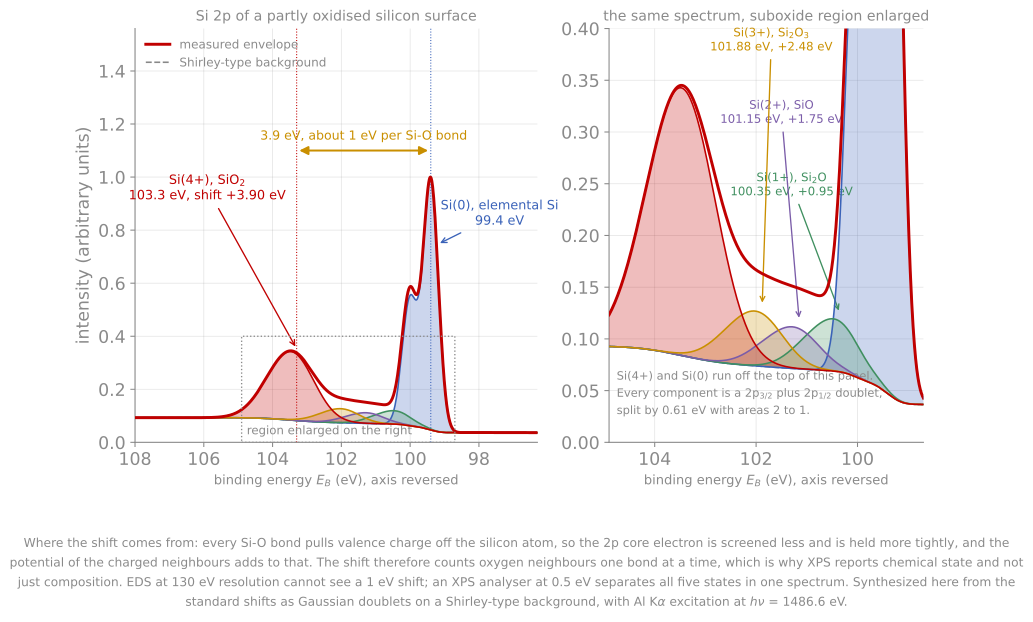
The Si 2p region of a partly oxidised surface, resolved into the elemental line and the four suboxide and oxide states. The 3.9 eV span is about 1 eV per Si-O bond, which is why XPS reports chemical state and not only composition.
Instrumentation
A modern XPS instrument combines a monochromated Al source, a concentric hemispherical analyzer, multichannel detection, a flood gun, and a UHV chamber with sample transfer. The analyzer physics is worth one paragraph because it sets the resolution economics: electrons are retarded by a lens system to a fixed pass energy before entering the hemispheres, and the analyzer’s absolute energy resolution is a fixed fraction of that pass energy. Running at constant pass energy therefore gives constant absolute resolution across the whole spectrum, with low pass energy for high-resolution chemical-state scans and high pass energy (more transmission) for surveys and trace elements: the resolution-versus-count-rate trade every operator makes.
Variants extend the technique along every axis. Angle-resolved XPS tilts the sample to shrink the sampled depth, giving nondestructive depth profiles of the top few nanometers (developed quantitatively on the next page). Imaging XPS maps chemistry at a few micrometers resolution. Synchrotron beamlines make the photon energy tunable, which turns both the cross sections and the escape depth into experimental knobs; hard X-ray photoemission (HAXPES) at 5 to 10 keV reaches tens of nanometers deep to see buried interfaces and true bulk chemistry; and ambient-pressure XPS uses differentially pumped analyzer optics to observe surfaces during catalysis or electrochemistry at millibar pressures, removing the technique’s oldest constraint. UPS, using ultraviolet photons (He I at 21.2 eV), measures the valence band with high cross section, and yields the work function directly from the spectrum’s low-energy cutoff: the width from the secondary-electron cutoff to the Fermi edge, subtracted from the photon energy, is the work function, the ensemble counterpart of the Kelvin probe maps of Module 7.
The quantification of XPS spectra, composition, overlayer thickness, and sputter depth profiling, is developed on the next page, together with Auger spectroscopy.
References and further reading
J. F. Watts and J. Wolstenholme, An Introduction to Surface Analysis by XPS and AES, 2nd ed., Wiley (2020).
J. F. Moulder et al., Handbook of X-ray Photoelectron Spectroscopy, Perkin-Elmer (1992). The standard spectral reference tables.
S. Hüfner, Photoelectron Spectroscopy, 3rd ed., Springer (2003). The deeper physics, including final-state effects.
G. Greczynski and L. Hultman, X-ray photoelectron spectroscopy: towards reliable binding energy referencing, Progress in Materials Science 107, 100591 (2020). Greczynski & Hultman (2020)
- Greczynski, G., & Hultman, L. (2020). X-ray photoelectron spectroscopy: Towards reliable binding energy referencing. Progress in Materials Science, 107, 100591. 10.1016/j.pmatsci.2019.100591