
The AFM feedback loop holds one interaction constant while scanning; add a second measurement channel and the same platform maps almost any local property alongside topography. These functional modes have made scanning probe microscopy the property-mapping counterpart to everything else in this course: the other techniques measure the structure and composition of a film, and SPM modes map its functional properties point by point. This page surveys the modes that matter most for thin films, then closes with scanning tunneling microscopy, the original scanning probe and still the highest-resolution imaging technique in existence.
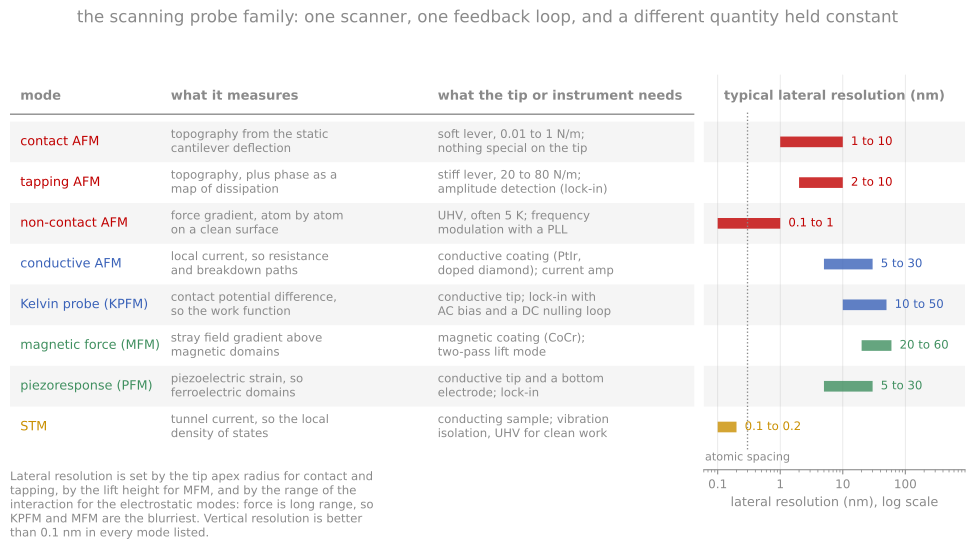
The scanning probe family on one chart: what each mode measures, what the tip or the electronics has to provide, and the lateral resolution it reaches.
Electrical and functional modes
Conductive AFM (c-AFM) applies a bias through a conductive (metal-coated or solid-metal) tip in contact and maps the resulting current, from picoamps up, resolving conduction nanoscale feature by feature: leakage hot spots and soft-breakdown sites in gate dielectrics, conductive filaments in resistive-switching oxides, grain-versus-boundary conduction in polycrystalline solar absorbers. Its close relative, scanning spreading resistance microscopy, presses harder through the native oxide with a diamond tip and converts the local spreading resistance to carrier concentration, the 2D dopant-profiling complement to SIMS.
Kelvin probe force microscopy (KPFM) measures the contact potential difference between tip and sample: an AC bias at frequency excites an electrostatic force whose component vanishes when an added DC bias exactly cancels the tip-sample work-function difference, so a nulling feedback outputs the local surface potential directly. Implementations differ in whether they detect the force (AM-KPFM) or the force gradient (FM-KPFM, sharper laterally because gradients are more local); either way the resolution is tens of millivolts and tens of nanometers. Work-function terrain reveals grain-to-grain facet variation, band bending at boundaries and contacts, charging of buried defects, and, under illumination, surface photovoltage maps that localize where photocarriers are lost, connecting directly to the ensemble work function from UPS.
Piezoresponse force microscopy (PFM) drives a contacting tip with an AC bias and detects, by lock-in on the deflection, the sample’s converse-piezoelectric surface oscillation: amplitude maps the magnitude of the local piezoresponse and phase maps polarization direction, imaging ferroelectric domains at domain-wall resolution. With a DC bias the same tip writes domains, so PFM both reads and patterns ferroelectric films, and switching-spectroscopy variants record local hysteresis loops pixel by pixel. Its standing challenge is separating true piezoresponse from electrostatic and electrochemical artifacts, which mimic the signal; careful work varies contact stiffness and frequency to prove the mechanism.
Magnetic force microscopy (MFM) senses magnetostatic force gradients with a magnetized tip, usually in a two-pass scheme: each line is first traced for topography, then retraced at a fixed lift height of tens of nanometers where van der Waals forces have died off and the long-range magnetic gradient dominates, read out as a resonance phase shift. Domain structures in magnetic films resolve at roughly 30 to 50 nm, in air, with no preparation; the tip’s own stray field can perturb soft magnetic structures, the mode’s known systematic.
Nanomechanical modes (force-curve mapping, contact resonance) extract modulus, adhesion, and dissipation at every pixel, mapping mechanical heterogeneity in polymer blends, composites, and low-k dielectrics.
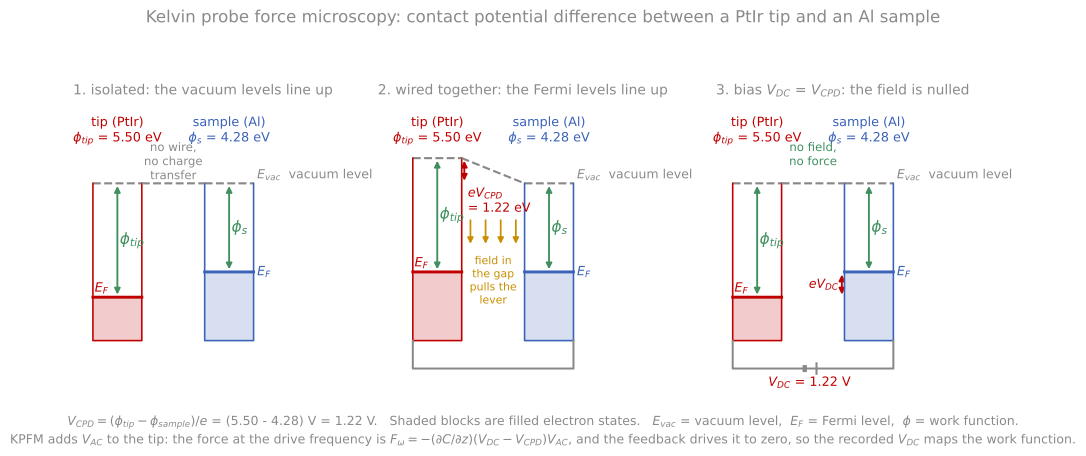
Tip and sample isolated, wired, and biased. Wiring aligns the Fermi levels and steps the vacuum levels by the contact potential difference; the applied bias that flattens them again is what KPFM records.
The shared caveat across all functional modes: the measured signal mixes the property of interest with topography, tip condition, and contact quality. Cross-talk from topography is the universal artifact (any feature that changes the contact area changes most signals), so the discipline is to compare the property map against topography for suspicious correlations, and quantitative claims require even more skepticism than AFM topography requires.
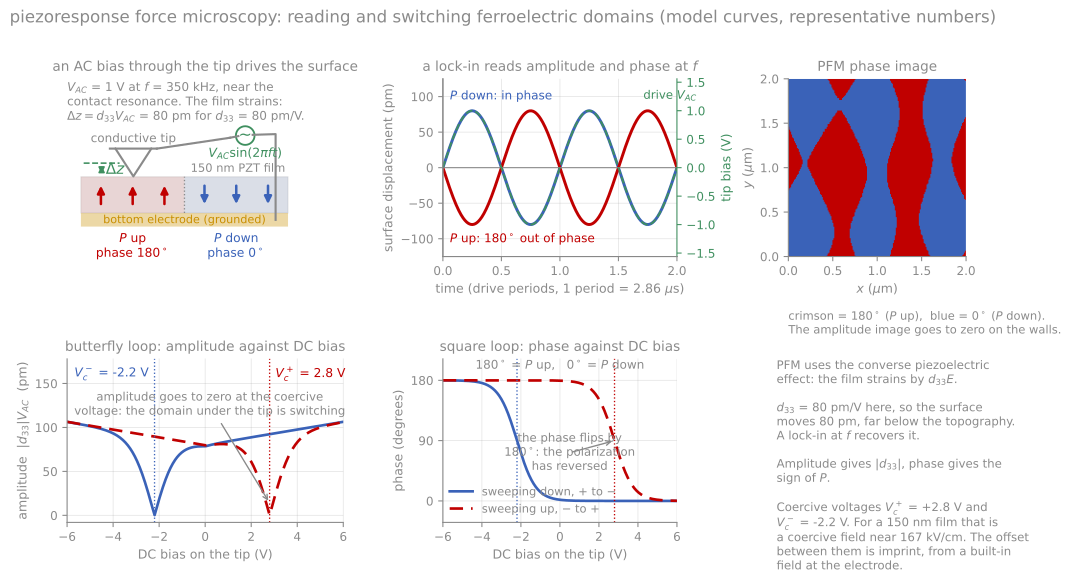
An AC bias drives a surface displacement that is in phase over one domain and 180 degrees out of phase over the other, which is the contrast. The DC sweep gives the butterfly amplitude loop and the square phase loop.
Scanning tunneling microscopy
The scanning tunneling microscope preceded and inspired all other scanning probes, and it remains unmatched in resolution. A bias of millivolts to volts is applied between a sharp metal tip and a conductive sample, and at tip-sample gaps below a nanometer, electrons tunnel quantum-mechanically across the vacuum gap. The tunneling current depends exponentially on the gap,
where is the tunneling current, the tip-sample gap, the decay constant of the wavefunction in the barrier, the electron mass, the reduced Planck constant, and the effective barrier height, close to the average work function of tip and sample. The current falls roughly an order of magnitude per angstrom for typical work functions. That exponential is the basis of the entire instrument: it confines the current overwhelmingly to the single outermost atom of the tip, giving atomic resolution laterally and picometer sensitivity vertically with no lenses and no diffraction limit. The Si(111) 7x7 reconstruction from the first module was solved in real space this way within two years of the instrument’s invention, the result that established the technique.
STM images are not topography. In the standard theoretical picture (Tersoff-Hamann), constant-current contours follow surfaces of constant local density of states at the tip position, evaluated at energies between the two Fermi levels, so the image entangles geometry with electronic structure: an electronegative adsorbate can image as a depression and a dangling bond as a protrusion, and the same surface can look qualitatively different at opposite bias polarities (which is itself information, famously separating the filled and empty states of semiconductor surfaces). Scanning tunneling spectroscopy (STS) makes the electronic content explicit: holding the tip fixed and sweeping the bias while recording with a lock-in yields a spectrum proportional to the local density of states, resolving band edges, superconducting gaps, defect states, and molecular orbitals atom by atom, and grid spectroscopy builds energy-resolved maps that underpin much of two-dimensional-materials and correlated-oxide physics.
STM feedback simulation
The demonstration below runs the feedback loop. The tip follows a contour of constant current, and the recorded trace is the image. Two sites make the central point: one atom with a high local density of states images taller than its neighbors, and an adsorbate with a low density of states images as a depression even though it physically sits above the surface. Raising the current setpoint moves the tip closer everywhere; lowering the work function softens the decay and washes out the corrugation.
Practical requirements
The requirements keep STM a research instrument rather than a routine metrology tool: conductive samples, atomically clean surfaces (hence UHV, and frequently cryogenic temperatures for drift stability and spectroscopic resolution), and vibration isolation good enough for picometer signals. In this course’s decision framework, STM answers questions about the atomic and electronic structure of a conductive surface that nothing else can answer at all, and AFM handles everything else.
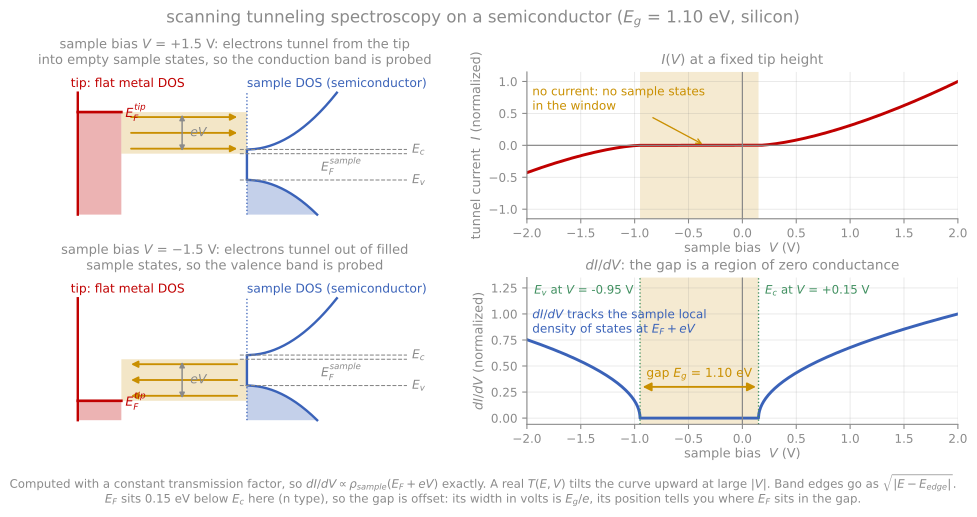
Which states each bias polarity probes, and the curve that follows the sample density of states, with the band gap appearing as a region of vanishing conductance.
References and further reading
B. Voigtländer, Scanning Probe Microscopy, Springer (2015). Covers the functional modes and STM at working depth.
C. J. Chen, Introduction to Scanning Tunneling Microscopy, 3rd ed., Oxford University Press (2021).
G. Binnig, H. Rohrer, Ch. Gerber, and E. Weibel, Surface studies by scanning tunneling microscopy, Physical Review Letters 49, 57 (1982). Binnig et al. (1982)
S. Sadewasser and T. Glatzel (eds.), Kelvin Probe Force Microscopy, 2nd ed., Springer (2018).
- Binnig, G., Rohrer, H., Gerber, Ch., & Weibel, E. (1982). Surface Studies by Scanning Tunneling Microscopy. Physical Review Letters, 49(1), 57–61. 10.1103/physrevlett.49.57