
Rutherford backscattering spectrometry (RBS) sends a beam of MeV helium ions at a sample and measures the energy spectrum of the ions scattered back to a detector near 165 to 170 degrees. Everything needed to interpret the spectrum was developed on the previous page: the kinematic factor converts energy to target mass, the stopping power converts energy loss to depth, and the Rutherford cross section converts count rate to concentration, absolutely and without standards. RBS is no longer a routine technique, accelerators are scarce and its niche has narrowed, but it remains the calibration anchor of thin film analysis: when another technique needs an absolute composition or areal density standard, that standard was probably measured by RBS.
| At a glance | |
|---|---|
| Probe in / signal out | MeV He ions in, backscattered He ions out |
| Information | Composition and film thickness versus depth, absolute areal density, heavy elements on or in light matrices |
| Depth probed | Up to a few micrometers; depth resolution 10 to 30 nm typical |
| Lateral resolution | Millimeter-scale beam spot (micro-RBS reaches micrometers) |
| Sensitivity | Excellent for heavy elements in light matrices (down to about 1013 atoms/cm); poor for light elements on heavy substrates |
| Sample requirements | Vacuum compatible, a few cm or smaller; nearly nondestructive |
Reading an RBS spectrum
Three rules decode any RBS spectrum, and each has a quantitative form worth knowing.
Energy identifies mass. An ion scattered from a surface atom of mass arrives at the detector with energy , so each element present produces a signal whose high-energy edge sits at its own kinematic factor. Mass resolution follows from the slope of with : the separation between neighboring masses is largest for light and medium elements and at the most backward angles (which is why detectors sit near 170°), and it collapses for heavy elements as . In practice a 2 MeV He beam separates Si from Al easily, struggles beyond mass 100, and cannot distinguish W from Ta; raising the beam energy or using a heavier projectile stretches the heavy-mass scale at the cost of other complications.
Energy loss measures depth. An ion scattered at depth loses energy along the inward path, is reduced by the factor in the collision, and loses more energy along the outward path of length . Collecting the terms, the energy deficit below the surface edge is proportional to depth,
where is the energy deficit below the surface edge, is the depth at which the ion scattered, is the kinematic factor, is the exit angle from the surface normal, is the stopping power on the inward and outward paths, and is the energy loss factor, evaluated in the simplest (“surface energy”) approximation at on the way in and on the way out. Typical values are a few hundred eV per nanometer, so a detector resolution of about 15 keV translates to a near-surface depth resolution of tens of nanometers, improvable by grazing exit geometries that stretch the outward path. A film of one element thus appears as a box whose width gives its thickness, or more precisely its areal density in atoms/cm, since stopping is what is actually measured; dividing by an assumed atomic density converts to nanometers, and this distinction is why RBS thickness values are honest in atoms/cm and model-dependent in nm.
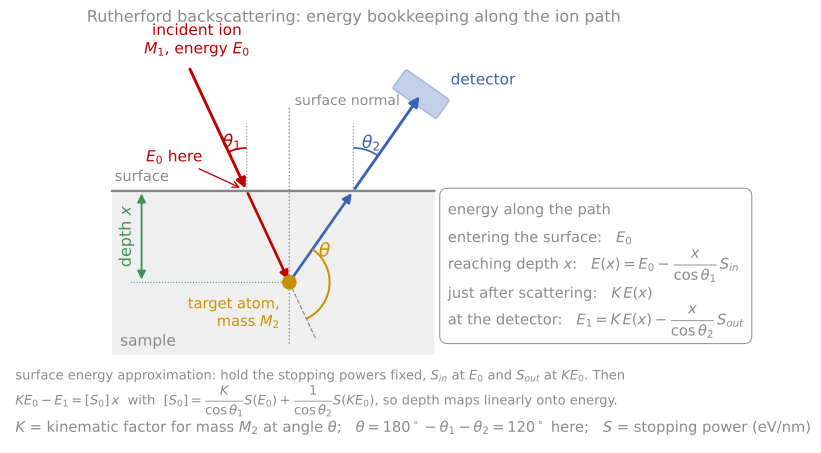
The energy bookkeeping along the ion path: loss on the way in, the kinematic factor at the collision, and loss on the way out. Holding the stopping powers fixed at and is the surface energy approximation, and it makes depth linear in energy.
Yield measures concentration. The count rate in a channel is proportional to the number of beam particles, the detector solid angle, the concentration of the scattering element, and the Rutherford cross section evaluated at the ion energy at that depth. Since the cross section is exact, relative concentrations follow with no standards at all, and with a measured beam dose (integrated current) absolute ones. The weighting makes the technique lopsided: the signature strength is heavy-on-light, where a submonolayer of Hf on silicon stands isolated at high energy above a low background, measurable to 1013 atoms/cm, about a hundredth of a monolayer. The signature weakness is the reverse: carbon or oxygen on a heavy substrate sits as a small bump on a large background, and their cross sections at MeV energies can also deviate from Rutherford because the He ion begins to touch the nuclear force (for oxygen there is a well-known strong resonance near 3.04 MeV that ion beam analysts exploit deliberately to boost oxygen sensitivity). Simulation and fitting programs (SIMNRA, RUMP) handle all of these effects and make multilayer interpretation routine; see the simulation appendix.
RBS spectrum simulation
The simulator below applies all three rules to a stack you define. The kinematic factors and the cross sections are exact; the stopping powers are approximate tabulated values, so treat depth scales as semi-quantitative. Reproduce the classic cases: a heavy marker layer (Au) standing isolated above a light substrate, the box width growing with film thickness, layer signals shifting down in energy as you bury them, and the hopeless overlap of two neighboring heavy elements.

Each contribution to the depth resolution against depth, in quadrature. Grazing exit stretches depth into energy and improves the near-surface figure from 11 nm to 4 nm, but straggling and geometric spread erase the advantage by 300 nm.
Instrumentation
RBS requires an electrostatic accelerator, typically a tandem in the 1 to 3 MV range, delivering a collimated, magnetically analyzed He beam to a scattering chamber, with the accumulated charge measured to convert yields into absolute quantities. The detector is a silicon surface-barrier diode: the backscattered ion generates electron-hole pairs in proportion to its energy (one pair per 3.6 eV in silicon), and the collected charge is the energy measurement. Its 12 to 15 keV resolution for He sets the standard depth resolution; electrostatic or time-of-flight analyzers improve on it by an order of magnitude in the specialized variants below. The classic applications built the field’s textbooks: measuring thin film reaction kinetics (watching a silicide layer grow between a metal film and silicon, with the reacted thickness read from the evolving spectrum, established the diffusion-versus-reaction-controlled growth laws of silicide formation), verifying implant doses, and certifying reference films that then calibrate SIMS, XPS, and EDS in other laboratories. Channeling measurements, in which the beam is aligned with a crystal axis to suppress scattering from lattice atoms and thereby measure crystalline quality, damage profiles, and impurity lattice sites, are covered in the channeling appendix.

The RBS measurement. An accelerator delivers 2 MeV He ions, a magnet fixes the beam energy , and slits define the beam. A silicon detector at a scattering angle of 170° measures the energy of each backscattered ion, a multichannel analyzer sorts them into a histogram (right, for a Au film on Si), and a charge integrator counts the incident ions so that every count is absolute.
Elastic recoil detection
RBS cannot see hydrogen: nothing backscatters from a lighter target, and hydrogen’s cross section is small regardless. Elastic recoil detection (ERD) measures the target atoms instead. The sample is tilted to grazing incidence and the beam knocks target atoms forward; from the recoil kinematics on the previous page, a detector at forward angle receives recoils of energy , so different target masses arrive at different energies and the same stopping-power bookkeeping converts energy to depth. With a He beam, a thin absorber foil in front of the detector stops the flood of forward-scattered He while passing the lighter, more penetrating H and D recoils: this simple arrangement is the standard quantitative hydrogen depth profile, the measurement behind hydrogen contents in diamond-like carbon, hydrogenated amorphous silicon, and hydride films. With heavy ion beams (tens of MeV iodine or gold) every light element in the film recoils measurably, and a detector that identifies each recoil species (a time-of-flight plus energy telescope) profiles B, C, N, O, and F simultaneously and quantitatively, a capability scarce but unique for light-element films such as nitrides and oxides.
Medium-energy ion scattering (MEIS) shrinks RBS to about 100 keV, where a toroidal electrostatic analyzer measures the scattered energy to a resolution equivalent to single atomic layers. The price of the lower energy is that screening corrections to the cross section grow and the analyzed depth shrinks to tens of nanometers, but within that window MEIS resolves the individual layers of an ultrathin gate-oxide stack, and in blocking geometry on crystals it measures surface relaxations. It bridges toward the single-layer sensitivity of LEIS.
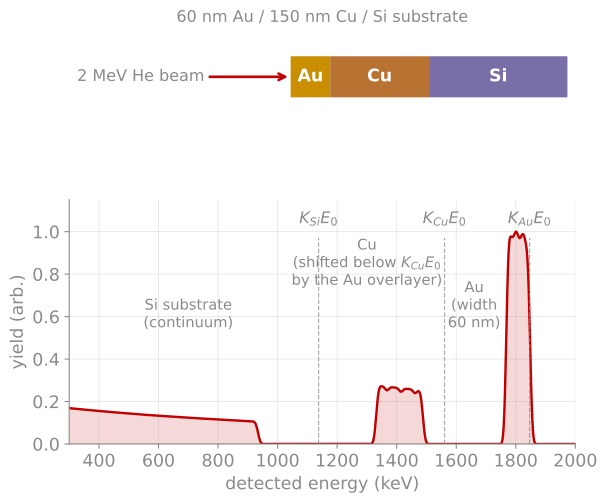
Spectrum formation. A 60 nm Au / 150 nm Cu / Si stack at 2 MeV (computed with this page’s physics). Each element’s signal begins at its kinematic edge and extends downward in energy with depth; burying the Cu under Au shifts its edge below by the energy lost crossing the gold.
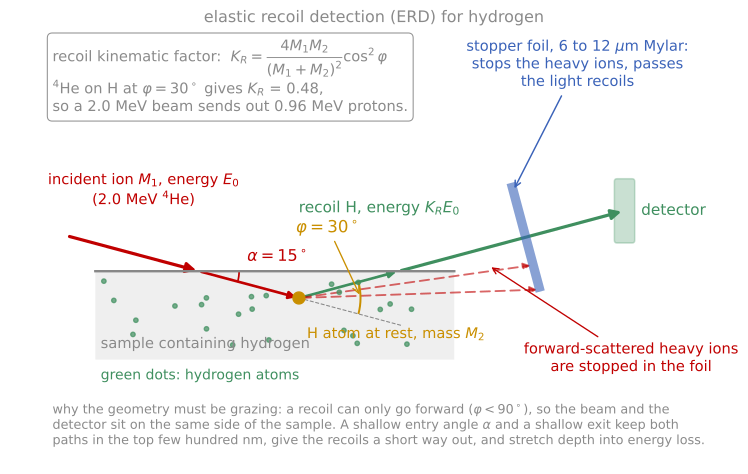
Elastic recoil detection for hydrogen. The beam and the detector sit on the same side because a recoil can only go forward, and the stopper foil passes the light recoils while blocking the forward-scattered beam ions.
References and further reading
W.-K. Chu, J. W. Mayer, and M.-A. Nicolet, Backscattering Spectrometry, Academic Press (1978). Still the definitive treatment; Chapters 2 to 5 cover this page.
L. C. Feldman and J. W. Mayer, Fundamentals of Surface and Thin Film Analysis, North-Holland (1986), Chapters 2 to 5.
M. Mayer, SIMNRA, a simulation program for the analysis of NRA, RBS and ERDA, AIP Conference Proceedings 475, 541 (1999). Mayer (1999)
- Mayer, M. (1999). SIMNRA, a simulation program for the analysis of NRA, RBS and ERDA. AIP Conference Proceedings, 541–544. 10.1063/1.59188