
Light is the cheapest, fastest, and least destructive probe we have, and a surprising amount of thin film metrology is purely optical. Spectroscopic ellipsometry measures film thickness and optical constants with sub-nanometer repeatability and is the dominant in-line thickness metrology of the semiconductor industry. Raman spectroscopy identifies phases, measures strain and doping, and characterizes disorder, all in seconds through a microscope objective. Photoluminescence and absorption spectroscopies measure the band structure that most functional films exist to provide. None of these requires vacuum, and all of them can be mapped across a wafer.
| At a glance | |
|---|---|
| Probe in / signal out | Polarized or monochromatic light in, reflected or scattered light out |
| Information | Thickness and optical constants (ellipsometry); phase, strain, doping, disorder (Raman); band gap and defect states (PL, absorption) |
| Depth probed | Optical penetration depth, nanometers (metals) to the full film (transparent materials) |
| Lateral resolution | Beam-limited: tens of micrometers (ellipsometry) to about 0.5 um (micro-Raman, micro-PL) |
| Sensitivity | Sub-nanometer thickness repeatability (ellipsometry); monolayer sensitivity for strong Raman scatterers such as graphene |
| Sample requirements | Optically accessible surface; measured in air, nondestructive |
Reflection of polarized light
Everything in ellipsometry follows from the Fresnel equations. Light polarized in the plane of incidence (p) and perpendicular to it (s) reflect with different amplitudes and phases, because the boundary conditions on the fields differ; for a single interface the two reflection coefficients are
where and are the refractive indices of the incident medium and the material, is the angle of incidence, and is the refraction angle inside the material, with complex for absorbing media. Near the Brewster angle passes through a minimum (zero for a transparent material), which is why ellipsometers work at incidence angles of 65° to 75°, where the p-s difference, and hence the sensitivity, is largest. A film on the substrate adds interference: each coefficient becomes the familiar two-interface sum with the film phase thickness , the same physics as the Kiessig fringes of XRR transposed to optical wavelengths.
Spectroscopic ellipsometry
Ellipsometry measures the ratio of these two reflection coefficients, expressed as
The complex ratio is what the instrument returns. The two measured quantities, the amplitude ratio and the phase difference , are recorded at each wavelength across the spectrum (typically 200 to 1700 nm; infrared ellipsometers extend further), and being a ratio they are self-referencing: no intensity calibration, no reference sample, and immunity to source drift, which is the root of the technique’s extraordinary precision. The phase is the workhorse for ultrathin films: a monolayer-scale overlayer barely changes any intensity, but it shifts the relative phase measurably, so ellipsometry tracks films well below one nanometer, which is why it monitors gate oxides and atomic layer deposition cycle by cycle. Practical instruments modulate the polarization, most commonly with a rotating compensator, and extract and from the harmonics of the detected signal; mapping ellipsometers raster a focused spot to produce full-wafer thickness images in minutes.
Ellipsometry does not measure thickness directly. The measured spectra are fit to an optical model of the stack, with layer thicknesses and dielectric functions as parameters. Transparent films use simple dispersion models (Cauchy or Sellmeier); absorbing films use oscillator models (Lorentz, Tauc-Lorentz for amorphous semiconductors, Drude terms for free carriers, which also makes ellipsometry an optical probe of carrier concentration); rough surfaces are commonly modeled as an effective-medium mixture of material and void (Bruggeman EMA). The fit minimizes a mean-squared error between model and data, and the standing caveats are the same as for XRR fitting: parameters correlate (thickness and index trade off strongly for very thin films, which is why ultrathin-film work fixes the index from a known bulk value), a wrong model can fit well and mislead, and agreement between ellipsometry and an independent thickness (XRR, or a stepped film measured by AFM) is the real validation. Reporting a thickness without stating the assumed index is a common and avoidable error.
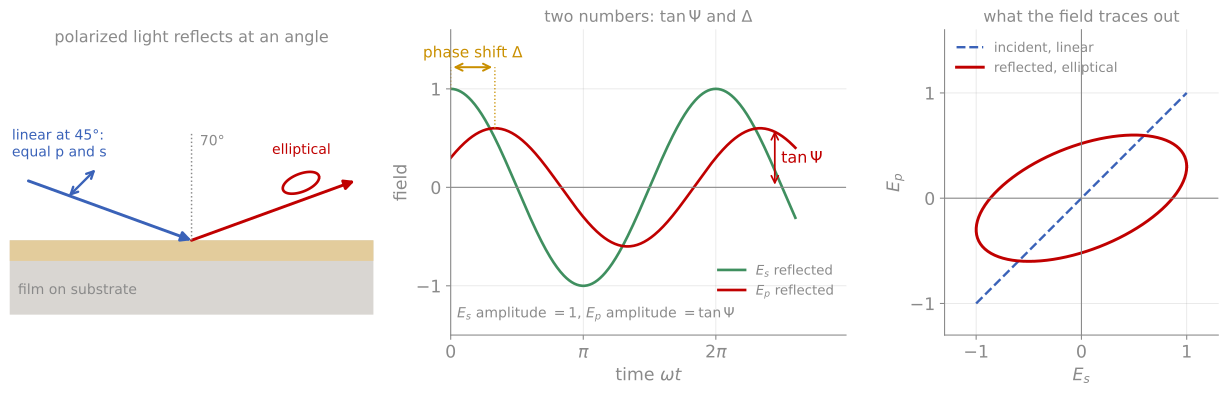
What and mean. Left: light polarized at 45°, with equal p and s components, reflects from the film and comes back elliptically polarized. Middle: after reflection the p field has an amplitude relative to the s field and is shifted in phase by . Right: the same two components traced out in the plane of and , a line before reflection and an ellipse after it.
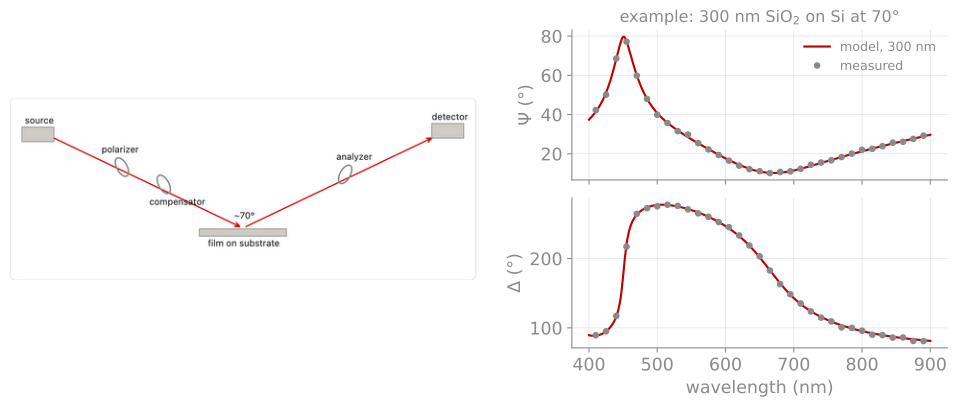
An example measurement. Left: ellipsometer layout, with source, polarizer, compensator, sample at about 70°, analyzer, and detector. Right: and spectra of 300 nm SiO on Si (points) and the fitted optical model (line), whose thickness is the result.
Thin film interference colors
The same interference physics that ellipsometry measures precisely is visible to the naked eye. The demonstration below computes the reflectance spectrum of an oxide or nitride film on silicon and converts it to the color you would see in the cleanroom: the famous oxide color chart. Judging thickness by eye against this chart, good to a few tens of nanometers once calibrated, is the oldest optical metrology in the semiconductor industry, and why the process history of a wafer can often be read from its color.
Raman spectroscopy
Raman spectroscopy measures the inelastic scattering of laser light by lattice vibrations. In the classical picture, the polarizability of the material is modulated by each vibrational mode, so the driven dipole radiates not only at the laser frequency (Rayleigh scattering) but at sidebands shifted down (Stokes) and up (anti-Stokes) by the phonon frequency; only modes that modulate the polarizability are Raman active, a symmetry selection rule complementary to infrared absorption (which requires a changing dipole moment; in centrosymmetric crystals the two selection rules are mutually exclusive). The Stokes side is stronger because it does not require a phonon to be thermally present, and the Stokes to anti-Stokes intensity ratio follows the Bose-Einstein occupation, providing a built-in local thermometer. Instrumentally, a modern micro-Raman system is a laser, a microscope objective (spot size near the diffraction limit, about 0.5 µm), a steep edge filter to reject the elastically scattered laser line, and a spectrograph; shifts are quoted in cm, with most phonons falling between 100 and 3000 cm.
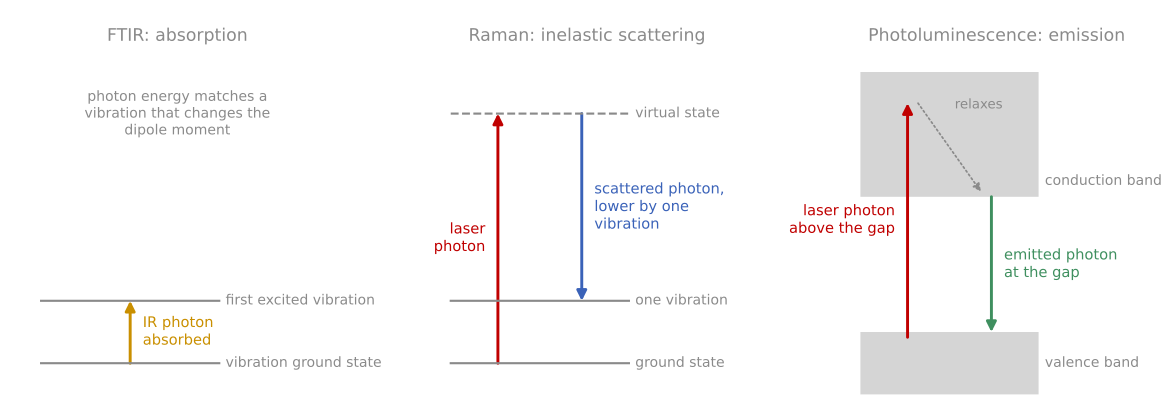
Three ways light exchanges energy with a film. Infrared absorption (FTIR): an infrared photon is absorbed by a vibration that changes the dipole moment. Raman: a laser photon scatters and leaves one vibration behind, so the scattered photon has less energy. Photoluminescence: a laser photon excites an electron across the band gap, the electron relaxes, and a photon is emitted at the gap energy.
For thin film work its virtues are speed, spatial resolution, and sensitivity to exactly the properties diffraction misses:
Phase and polymorph identification, including amorphous phases invisible to XRD: crystalline silicon shows a sharp line at 520 cm while amorphous silicon shows a broad band near 480 cm, so one spectrum quantifies crystalline fraction in mixed-phase films, a standard measurement in thin-film photovoltaics.
Strain, which shifts phonon frequencies by a few cm per GPa through the anharmonicity of the lattice; Raman mapping of strain around device features and laser-processed regions is standard failure-analysis practice.
Disorder and doping, most famously in carbon materials, where the defect-activated D band near 1350 cm against the G band near 1580 cm quantifies disorder in everything from graphene to diamond-like coatings; in graphene the 2D band lineshape counts layers, and Raman shifts also track doping level.
The limits are the flip side of the physics: cross sections are tiny (roughly one photon in 108), metals give almost no signal (screened polarizability and nanometer optical penetration), fluorescence can swamp the spectrum (often cured by changing laser wavelength), and laser heating can modify a thin film mid-measurement, so power dependence should be checked before trusting peak positions.
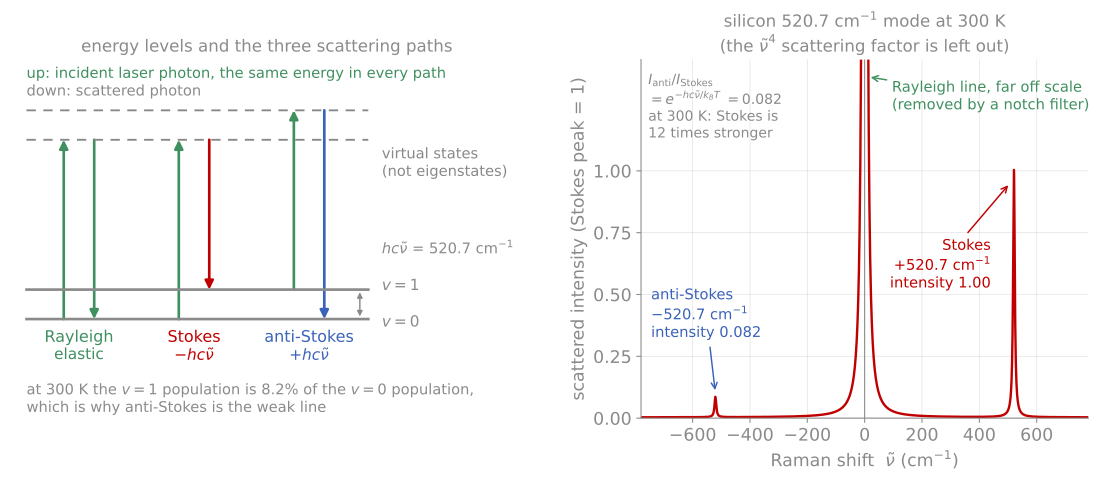
The three scattering paths and the spectrum they produce for the silicon 520.7 cm mode. The anti-Stokes line is weaker by the Boltzmann factor, which is what makes the ratio a thermometer.
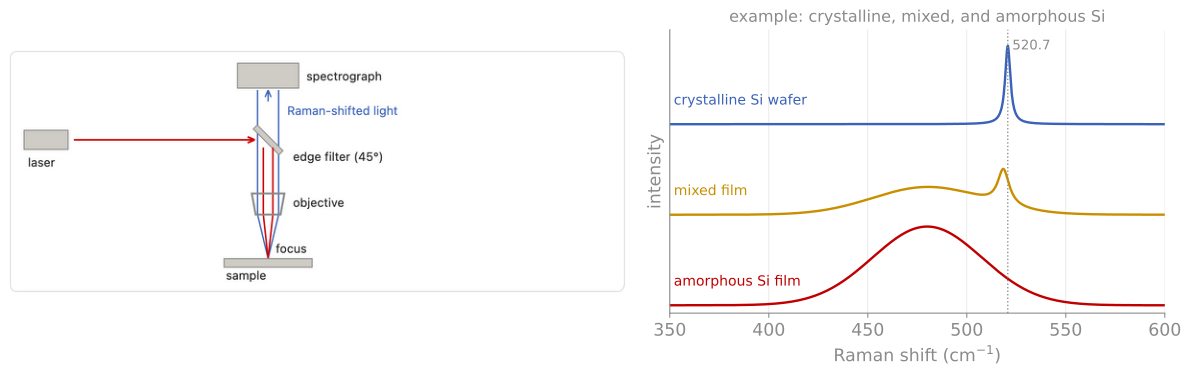
An example measurement. Left: micro-Raman layout, with laser, edge filter, objective, and spectrograph. Right: spectra of crystalline Si (sharp line at 520.7 cm), a mixed film, and amorphous Si (broad band near 480 cm).
The atomic motions behind Raman and infrared lines can be complex: see the phonon modes of ZnPS, animated in 3D.
Photoluminescence and absorption
For semiconducting films, photoluminescence (PL) and optical absorption close the loop on electronic quality. PL excites carriers with an above-gap laser and spectrally resolves their radiative recombination: the peak position tracks the band gap and its shifts with composition, strain, or quantum confinement, while the intensity and linewidth track defect density, since nonradiative recombination at defects competes with emission; time-resolved PL extends this to carrier lifetimes, the single most predictive quantity for photovoltaic material quality. Absorption or transmission spectra locate the gap directly, commonly through a Tauc analysis (plotting or for indirect and direct gaps respectively and extrapolating to zero), and reveal sub-gap defect absorption. Both are routine wafer-mapping tools for photovoltaic and optoelectronic films, where a PL image flags bad regions before any device is fabricated. Fourier-transform infrared spectroscopy (FTIR) rounds out the family: vibrational absorption identifies bonding configurations in dielectrics (Si-H, Si-OH, and B-O contents in deposited oxides are standard FTIR assays) through the infrared selection rule that complements Raman.
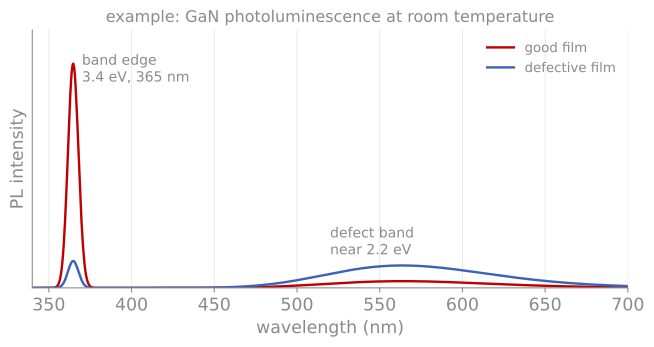
Photoluminescence of GaN at room temperature. The band-edge peak at 3.4 eV (365 nm) is strong in a good film (red) and weak in a defective one (blue), whose broad defect band near 2.2 eV is stronger.
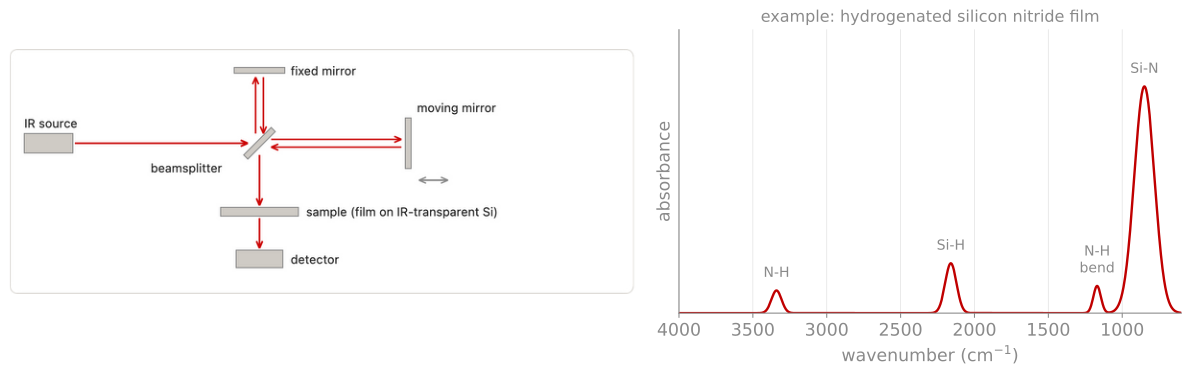
An example FTIR measurement. Left: Michelson interferometer, with source, beamsplitter, fixed and moving mirrors, sample, and detector. Right: absorbance of a hydrogenated silicon nitride film, with the Si-N, Si-H, and N-H bands that give its hydrogen content.
References and further reading
H. Fujiwara, Spectroscopic Ellipsometry: Principles and Applications, Wiley (2007).
H. G. Tompkins and E. A. Irene (eds.), Handbook of Ellipsometry, William Andrew (2005).
A. C. Ferrari and D. M. Basko, Raman spectroscopy as a versatile tool for studying the properties of graphene, Nature Nanotechnology 8, 235 (2013). Ferrari & Basko (2013)
D. K. Schroder, Semiconductor Material and Device Characterization, 3rd ed., Wiley (2006), Chapter 10.
- Ferrari, A. C., & Basko, D. M. (2013). Raman spectroscopy as a versatile tool for studying the properties of graphene. Nature Nanotechnology, 8(4), 235–246. 10.1038/nnano.2013.46