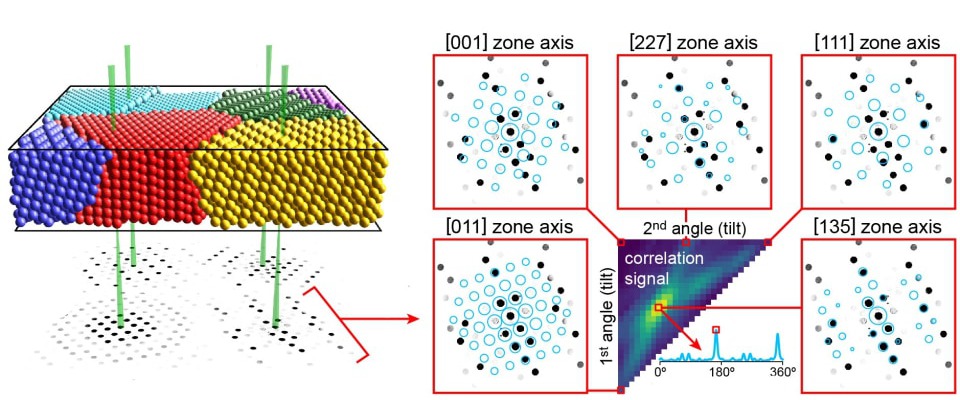
Most functional and structural materials are polycrystalline, and their properties depend on grain size, texture, grain boundary character, and phase distribution. Automated crystal orientation mapping (ACOM) in 4D-STEM Rauch & Véron (2014) measures all of these: at every probe position, the recorded diffraction pattern is matched against a library of patterns simulated over all possible crystal orientations, and the best match assigns a local orientation, similar to electron backscatter diffraction (EBSD) in the SEM but in transmission, with nanometer resolution, and on the same datasets used for every other analysis in this course.
How it works
Reference structures. Load the candidate crystal structures (e.g., from CIF files) and compute their structure factors up to the maximum scattering vector recorded on the detector.
Orientation plan. Simulate diffraction patterns over a grid of orientations covering the symmetry-reduced zone axis range: a lookup table of expected Bragg peak positions and intensities. Grid spacings of a few degrees, with local refinement, balance accuracy against speed.
Bragg peak detection. As for strain mapping, detect the diffraction peaks at every probe position (the same calibrated Bragg vectors feed both analyses).
Correlation matching. For each probe position, score the measured peaks against the orientation library Ophus et al. (2022) and keep the best match(es). Returning multiple matches with a minimum angular separation handles overlapping grains along the beam direction.
Orientation and phase maps. The result is an orientation map (typically displayed with inverse-pole-figure coloring for in-plane and out-of-plane directions), plus per-position correlation scores. Running plans for multiple candidate phases and comparing their correlation scores produces a phase map, along with quantitative phase-fraction estimates.
Precession and pattern quality
Zone-axis nanobeam patterns are strongly dynamical: intensities oscillate with thickness and small mistilts, which degrades matching against kinematical templates. Precession electron diffraction (PED) Midgley & Eggeman (2015), which rocks the beam on a cone (typically ~0.3–1°) while descanning below the sample, integrates through the rocking curve and produces more kinematical-like, more complete patterns:
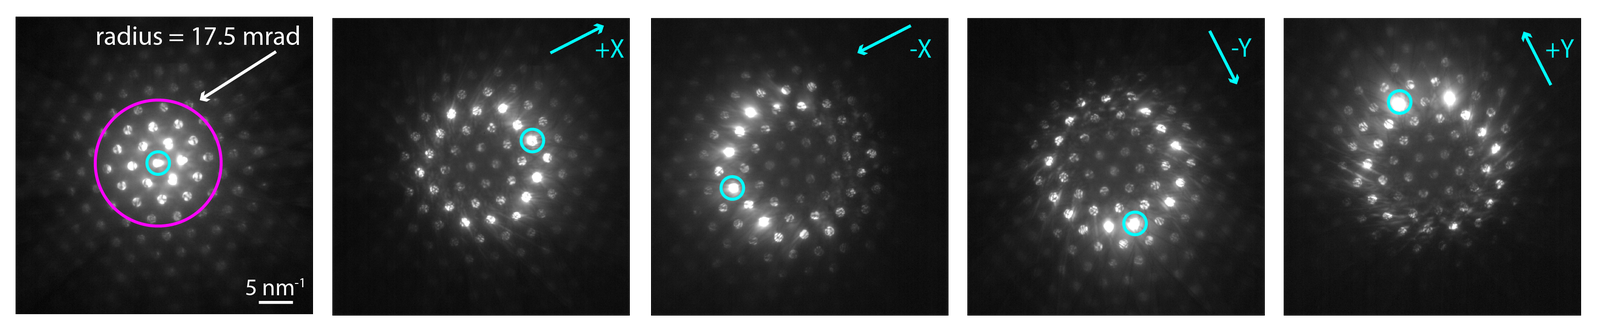
The effect of precession: as the rocking radius increases, more reflections are excited and their intensities become more uniform, much closer to the kinematical patterns the orientation library assumes.
Precession substantially improves both orientation reliability and phase discrimination, and the tutorial dataset for this module is a precession 4D-STEM measurement of a two-phase (α + β) titanium alloy MacLaren et al. (2024), archived openly at the University of Glasgow research data repository.
Phase mapping in hard cases
Phase discrimination gets genuinely difficult when the candidate structures are closely related: polymorphs sharing a parent lattice, with only subtle differences in symmetry and spacing. Ferroelectric hafnium zirconium oxide (HZO) is a canonical example:
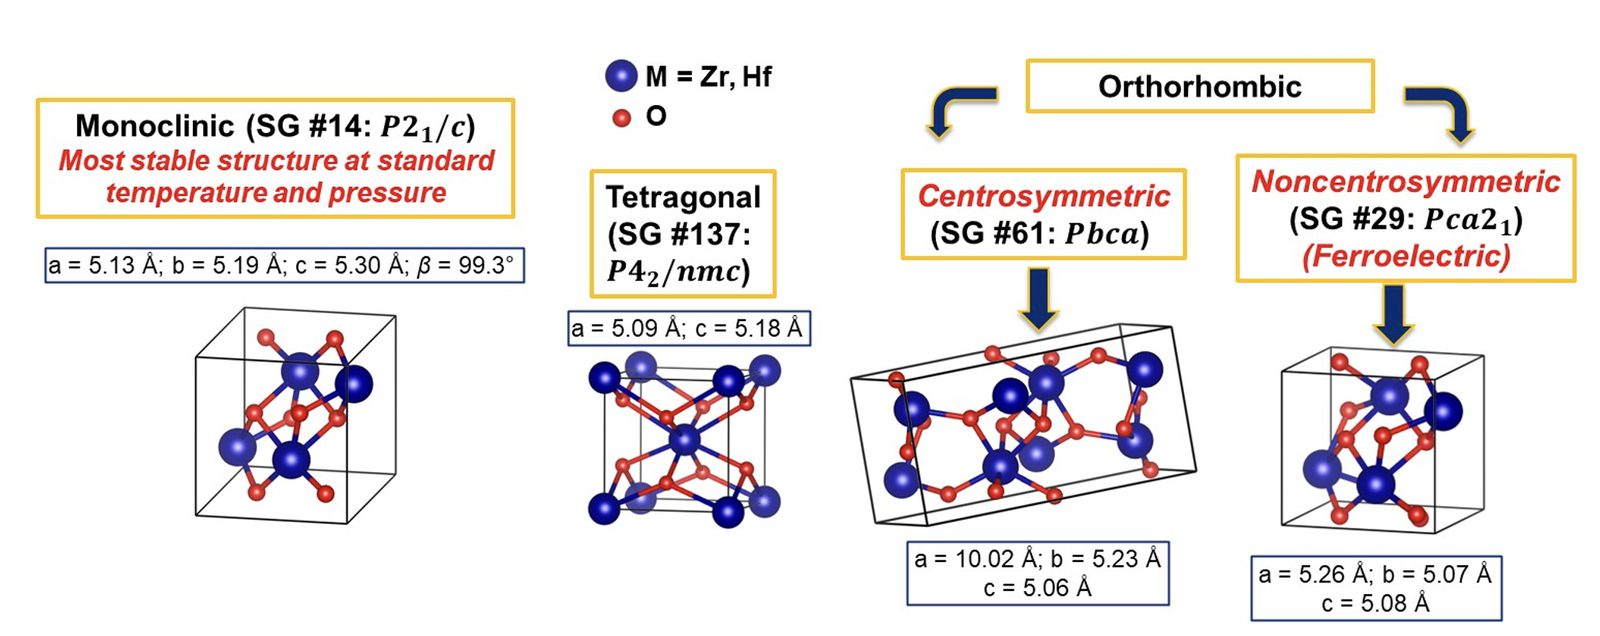
The HZO polymorph problem: monoclinic, tetragonal, and two orthorhombic phases (one of them the ferroelectric structure) differ only slightly in lattice parameters and symmetry, a stringent test for diffraction-based phase mapping.
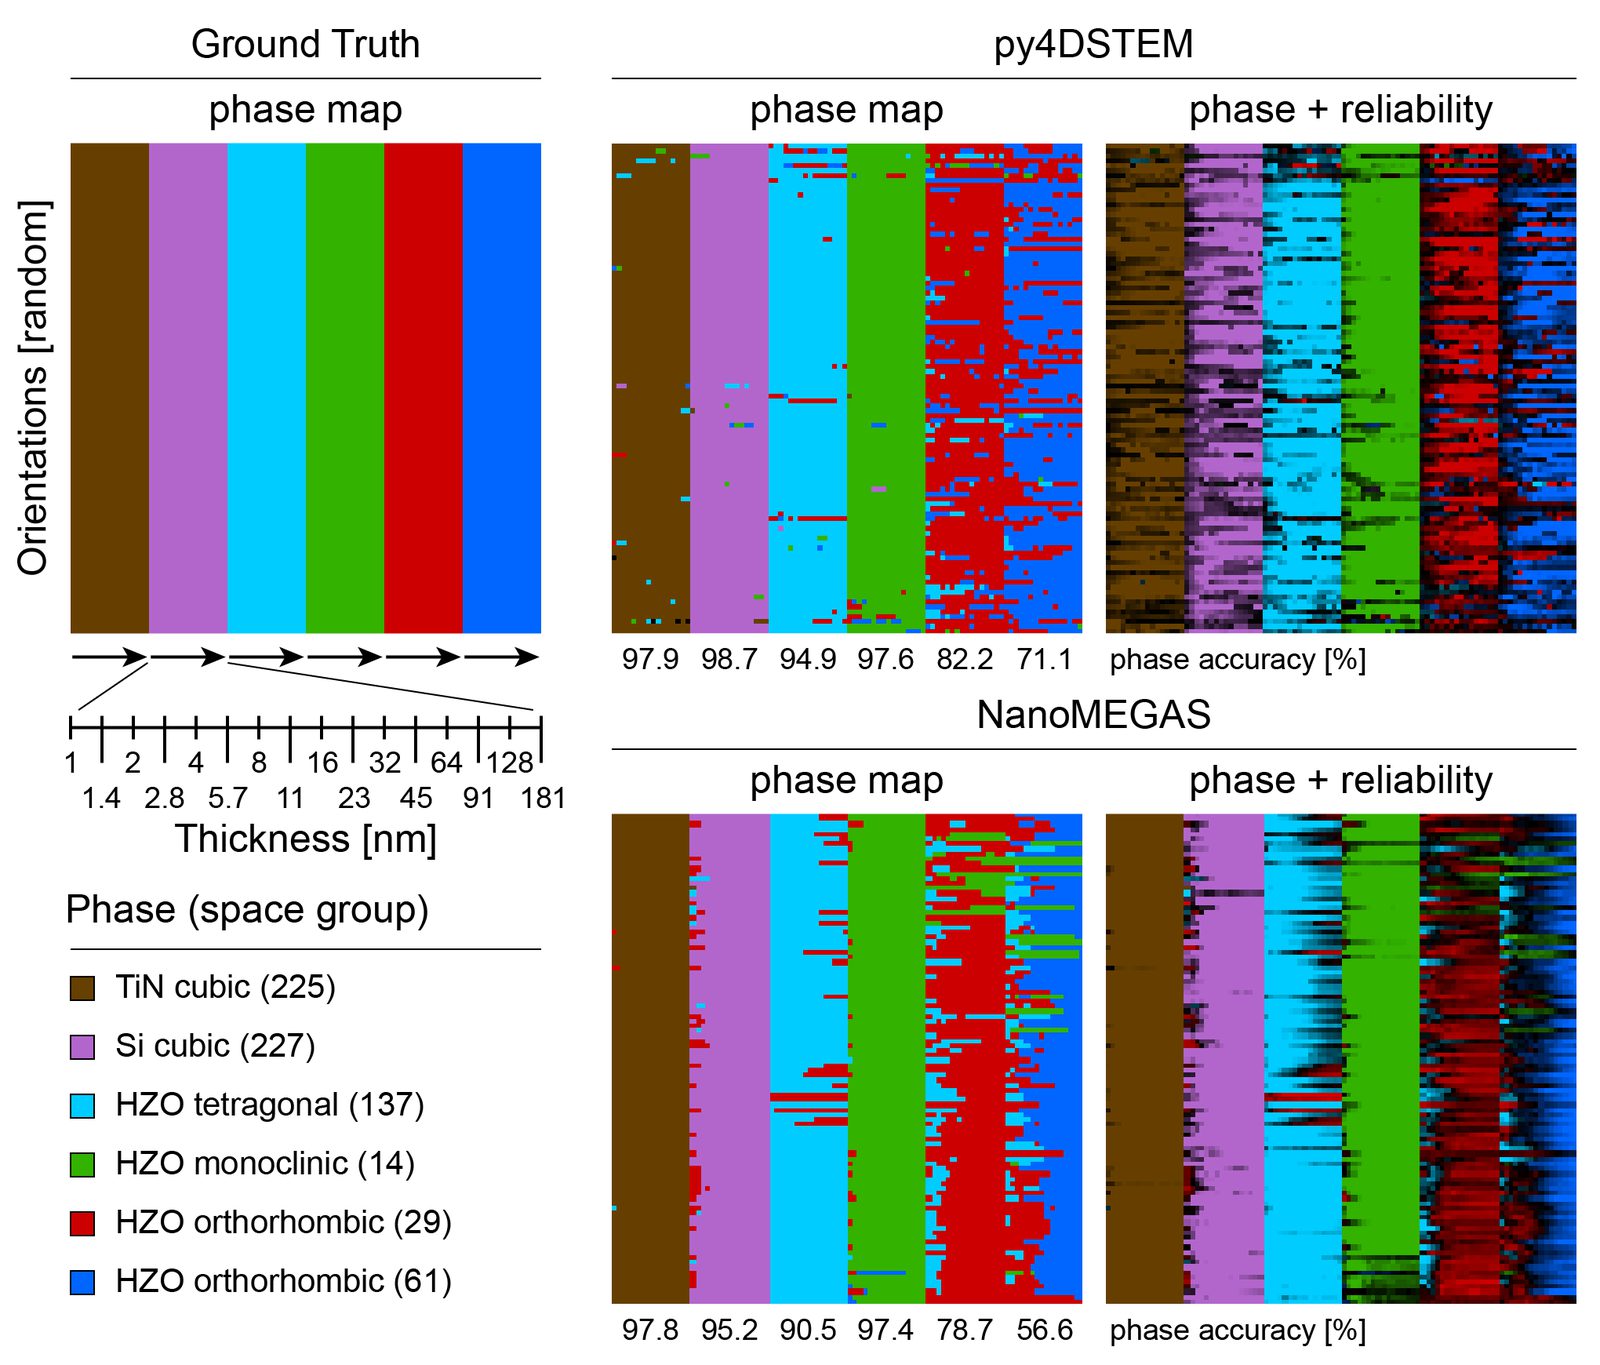
Benchmarking phase mapping on simulated HZO data with known ground truth: recovered phase maps and reliability scores can be validated quantitatively before the method is trusted on experiments.
Practical notes
Pattern matching is only as good as the calibration: the reciprocal pixel size can be refined by fitting the measured Bragg peak radial distribution against the structure factors of a known phase in the sample.
Correlation score maps are worth inspecting on their own: low scores flag overlapping grains, unindexed phases, or regions where the library doesn’t contain the right structure.
Template matching of the full patterns (as in pyxem Cautaerts et al. (2022)) and sparse peak matching (as in py4DSTEM’s ACOM) are complementary approaches; both are open source, so you can try each on your data.
ACOM gives you strain for free: the distortion between each measured pattern and its best-matched simulation yields a per-phase strain map, with no manual choice of basis vectors.
- Rauch, E. F., & Véron, M. (2014). Automated crystal orientation and phase mapping in TEM. Materials Characterization, 98, 1–9. 10.1016/j.matchar.2014.08.010
- Ophus, C., Zeltmann, S. E., Bruefach, A., Rakowski, A., Savitzky, B. H., Minor, A. M., & Scott, M. C. (2022). Automated Crystal Orientation Mapping in py4DSTEM using Sparse Correlation Matching. Microscopy and Microanalysis, 28(2), 390–403. 10.1017/s1431927622000101
- Midgley, P. A., & Eggeman, A. S. (2015). Precession electron diffraction – a topical review. IUCrJ, 2(1), 126–136. 10.1107/s2052252514022283
- MacLaren, I., Frutos‐Myro, E., Zeltmann, S., & Ophus, C. (2024). A method for crystallographic mapping of an alpha‐beta titanium alloy with nanometre resolution using scanning precession electron diffraction and open‐source software libraries. Journal of Microscopy, 295(2), 131–139. 10.1111/jmi.13275
- MacLaren, I., Myro, E., Zeltmann, S., & Ophus, C. (2023). A method for crystallographic mapping of an alpha-beta titanium alloy with nanometre resolution using scanning precession electron diffraction and open-source software libraries. University of Glasgow. 10.5525/GLA.RESEARCHDATA.1514
- Cautaerts, N., Crout, P., Ånes, H. W., Prestat, E., Jeong, J., Dehm, G., & Liebscher, C. H. (2022). Free, flexible and fast: Orientation mapping using the multi-core and GPU-accelerated template matching capabilities in the Python-based open source 4D-STEM analysis toolbox Pyxem. Ultramicroscopy, 237, 113517. 10.1016/j.ultramic.2022.113517